Being the decision maker for your business isn’t always the most comfortable role. But for agencies who want to grow or mature as a business, whether that be for acquisition or not, the kinds of decisions that need to be made are of greater importance and have a significant impact. For these agencies, it is crucial they take their business intelligence (BI) reporting to the next level. To accomplish this enhanced level of analytics, decision makers sometimes turn to out-of-the-box BI tools to translate large volumes of data into generic insights, but too often they must spend additional effort translating that into what works for their agency’s specific needs.
But with Deltek WorkBook Intelligence, decision makers can improve reporting with customizable dashboards that fit their agency’s specific needs without the hassle of gathering and translating gobs of data into something useable. WorkBook Intelligence makes it easier to discover actionable insights that lead to better decisions for growth.
As part of the total agency management solution, WorkBook Intelligence includes several standard dashboards that provide valuable analysis of agency KPIs.
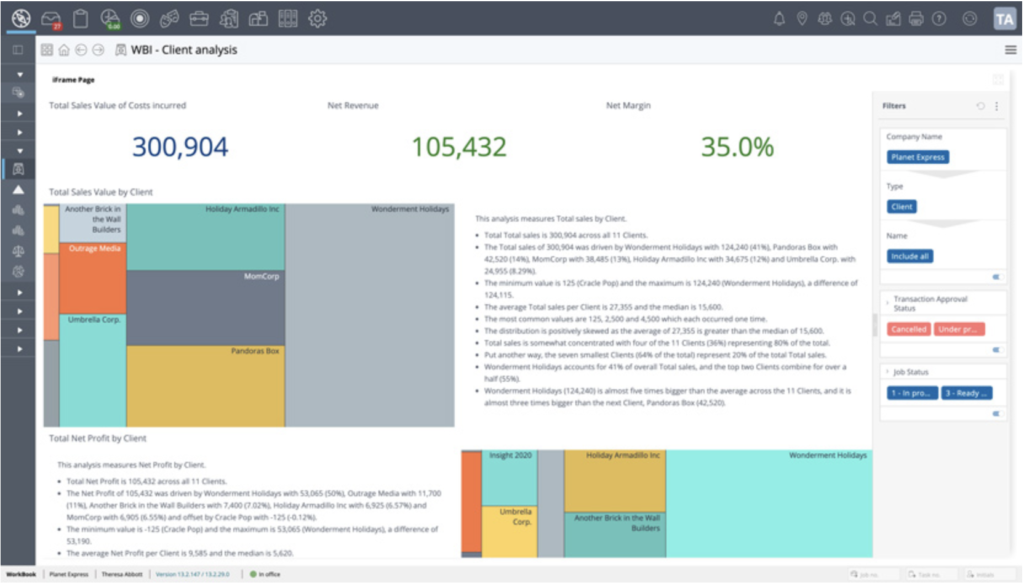
Client Analysis Dashboard
The Client Analysis dashboard is useful for comparing the relative performance of clients and the margin that each client is delivering.
This dashboard provides an overview of the sales and profit attributed to clients based on the jobs contained within that client record. The available filters allow you to refine the specific client or group of clients on which you want to get analysis. The analysis provided shows the sales values of costs incurred and the associated profit of those costs.
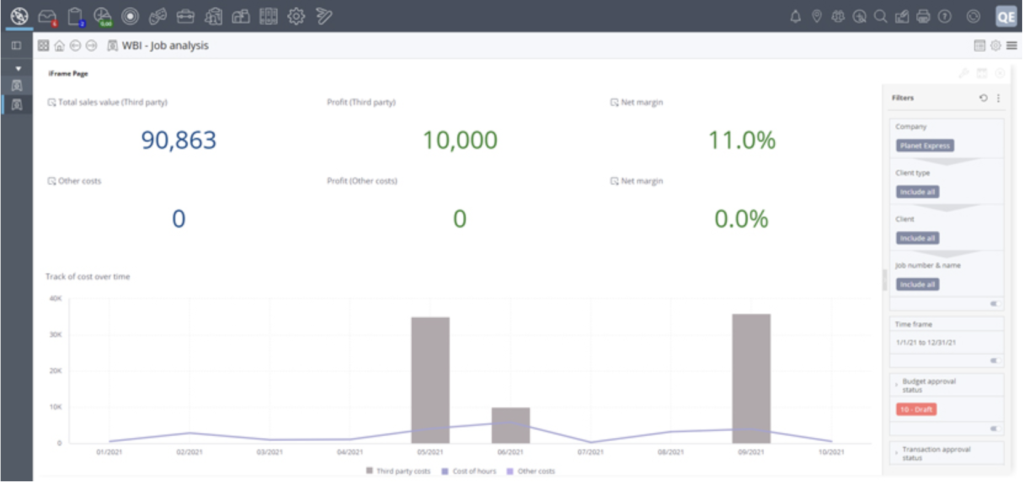
Jobs Analysis Dashboard
The Jobs Analysis dashboard is best used to compare the relative performance of multiple jobs to identify anomalies or outliers and, once identified, to drill down into the specific detail of those jobs to the transaction level to pinpoint potential problems or issues that require action.
This dashboard provides an overview of the sales and profit attributed to jobs and enables you to compare the performance of jobs relative to each other, either across the entire Company or within a selected client or clients, depending on the filters that you apply. The available filters allow you to further refine the nature of data to analyze, based on the status of the jobs or the approval status of the transactions within them. The widgets on the dashboard show the sales values of costs incurred and the associated profit of those costs.
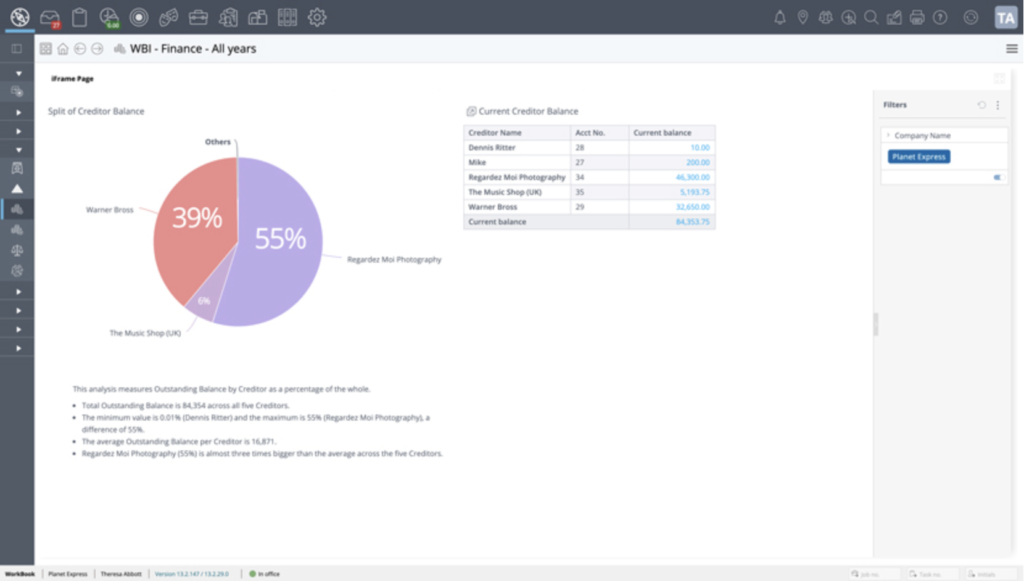
Finance – All Years Dashboard
The Finance – All Years dashboard is useful for agencies that are part of a network with different offices or companies sharing the same WorkBook solution. It shows an overview of the financial results of a single selected Company across all finance years in your WorkBook system, as it enables you to filter one Company at a time. It displays numeric data in the Company currency of that selected Company.
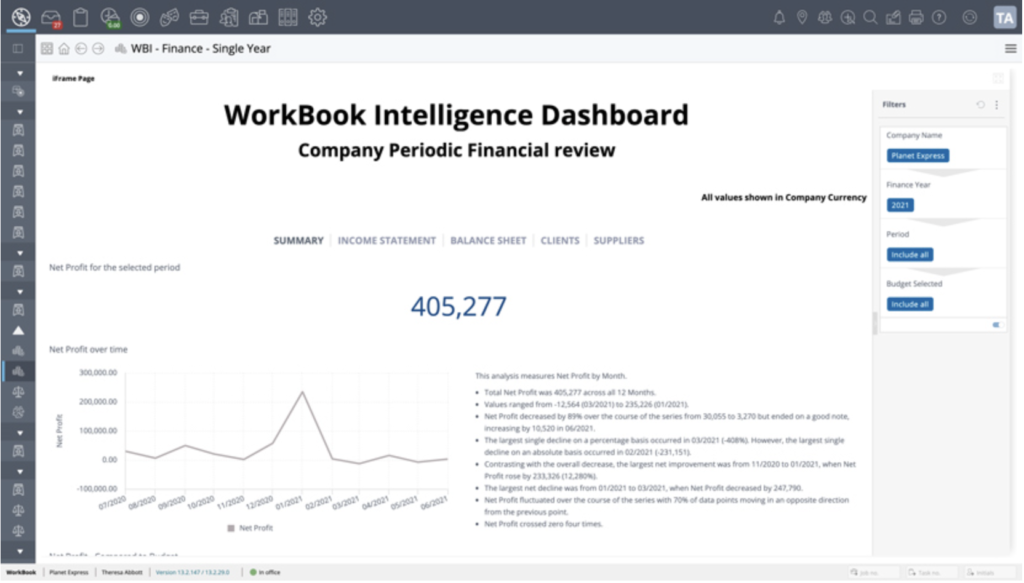
Finance – Single Year Dashboard
The Finance – Single Year dashboard is similar in that it is meant to show the financial data of a single company within a network of agencies. This dashboard shows an overview of the financial results of a single selected Company for a single selected financial year. Again, it displays numeric data in the Company currency of that selected Company.
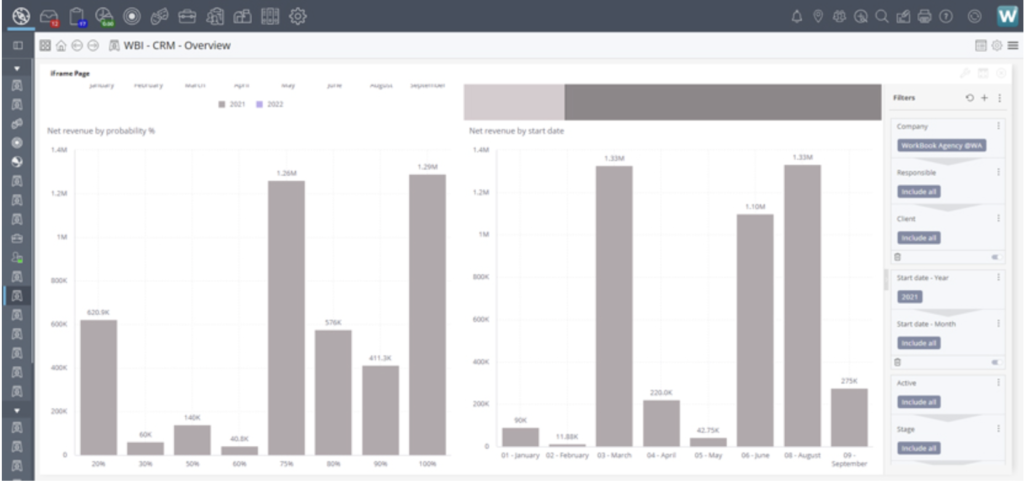
CRM Dashboard
The CRM dashboard provides an overview of the value of pipelines on clients and prospects within your WorkBook system. An extensive range of filters gives you the ability to remove unwanted detail and focus on pipelines for specific clients, time periods, statuses, and levels of progression.
Data is shown both in a “full value” state and with the consideration of any probability that might have been applied, which means you can see a weighted total of pipelines, based on their respective probabilities which has an impact on expected revenue. All values are displayed in the Company currency of the selected Company.
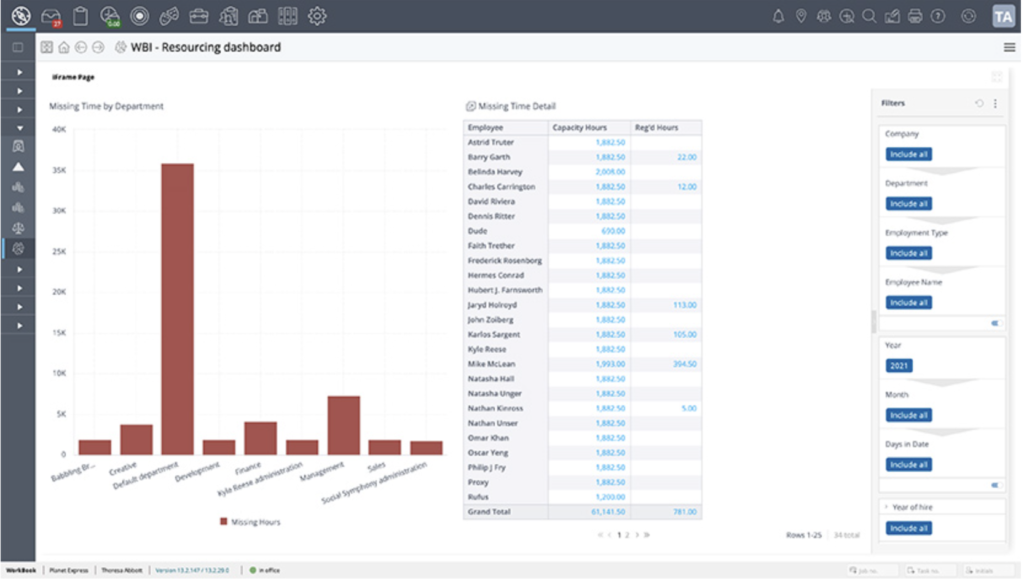
Resourcing Dashboard
You can use the Resourcing dashboard to identify individuals, or groups of employees—for example, in departments—who have limited available capacity relative to the scheduled bookings made against them, or who have outstanding timesheets relative to their total capacity. For this dashboard, a large number of filters are available, including the ability to filter on more than a single Company, by department, or by employment type.
Create your own WorkBook Intelligence Dashboards with a Designer License
For agencies that are ready to elevate their business intelligence and need dashboards that provide insights not found in the standard offering, a Designer License allows you to create your own WorkBook Intelligence dashboards using the predefined data models provided.
With a Designer license you can:
- Create a dashboard on the Analytics tab of the WorkBook Intelligence Design page.
- Create and edit dashboard controls in the header ribbon when a dashboard is in Design mode.
- Customize a dashboard’s layout by rearranging the widgets that are part of the dashboard.
- Create nested dashboards that are suitable for drilling down into the detail of widgets on a dashboard.
- Use filters to show only the data you want to be shown.
- Copy, export, import, and delete dashboards.